The
Advanced Data & Charting package is required to access Renko Charts.

Creating a Renko Chart
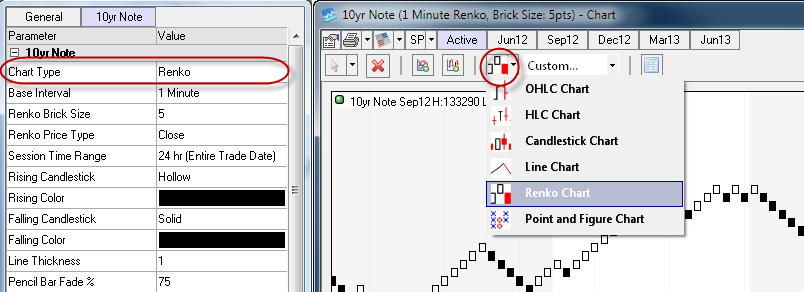
There are two ways to switch to a Renko chart. Either use the Chart Type drop down button on the toolbar, or change the chart type from the properties window.
(Note: When switching between Renko and any other chart type, all studies and drawing tools are removed from the chart.)

This will change the chart to a Renko type of chart and activate additional configuration properties.
- Renko Base Interval – Change the base interval for creating historical Renko bricks.
- Renko Brick Size – Change the size of the bricks in pricing increments (in this case 5 price movements or 125)
Renko Concepts
Renko charts are built off of an "underlying" data set. By default, the Renko charts are created off of 1 minute bar closing prices. There is a configuration option to change from using the 'close' value to using the 'high/low' values of the bars instead. The interval is also user-configurable (e.g. 15-minute, 1-hour, etc.)
The Renko chart use a "pencil-in" feature when updating from live data. The chart updates real-time on every trade in the market. However, until the underlying bar officially closes, the chart will only temporarily display this live data. If the next trade changes the current underlying bar, these temporary updates are erased and redrawn. Pencilled-in updates are displayed faded out so that they can be distinguished from the permanent data. Any studies displayed on the chart will also update on real time trades, however the studies will not be displayed faded out (only the point and figure boxes).
Subscribers of the Advanced charting package have the option of changing the underlying data set to '1 Trade'. This results in a tick-based Renko chart which updates upon every trade in the market.
Brick size is configurable on the Renko charts as well. This configuration is done in price increments. e.g. a Renko chart with a brick size of 5 would mean that every brick displayed on the chart covers 5 price increments.
Renko Brick Shape
The shape of the Renko bricks on our charts may not necessarily be perfectly square as you would expect. If you want them to look that way, right-click drag on the time/price axes to adjust the brick sizes as appropriate.
Studies on Renko Charts
Renko charts only support a subset of studies of the regular charts. If you require a particular study and do not see it listed in the available studies feel free to drop our support an email and we will look into getting it added.